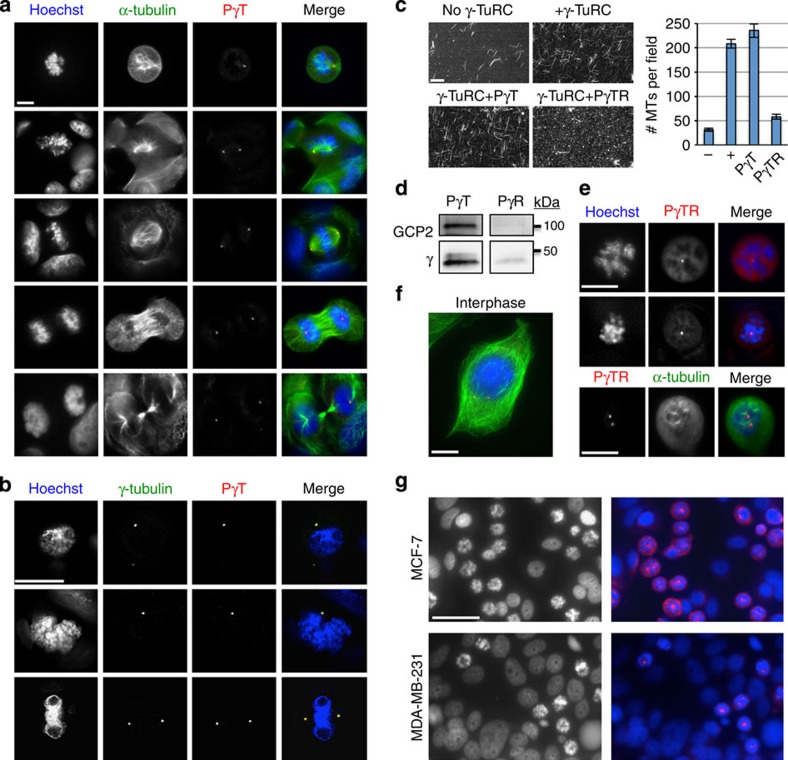
Figure 9. Yeast γ-TuRC peptide PγTR causes mitotic arrest in human breast cancer cells.
Conserved action of the minimal Pkl1 Tail domain. (a) Localization of γ-TuRC targeting peptide PγT to centrosomes in fixed human MCF-7 breast cancer cells. DNA is shown in blue (Hoechst), microtubules in green (α-tubulin) and PγT peptide in red. 6-His tagged PγTR was administered before addition of primary antibodies. (b) Co-localization of γ-tubulin and PγTR to centrosomes in mitotic MCF-7 cells. Scale bars in (a) and (b) are 10 μm. (c) In vitro γ-TuRC microtubule nucleation assays. No γ-TuRC negative controls provide background for spontaneous microtubule formation from tubulin (1.5 μg μl−1). All other samples use whole-cell extract from human breast cancer cells. γ-TuRC targeting and regulatory peptide PγTR blocks γ-TuRC nucleation efficacy. Scale bar, 20 μm (mean±s.d. for number of microtubules per field, n=3 experiments). (d) Magnetic bead co-immunoprecipitation of γ-TuRC core proteins GCP2 and/or γ-tubulin using 6-His-tagged PγT (targeting) and PγR (regulatory) peptides (see Fig. 2d for method). (e) High-magnification images of MCF-7 cells arrested by PγTR (live cell transfection). DNA is in blue (Hoechst) and PγTR is in red (top). Microtubules are shown in the bottom panel in green. Scale bar, 10 μm. (f) Non-arrested MCF-7 cell containing low levels of PγTR. Scale bar, 10 μm. (g) Mitotic arrest in MCF-7 (low-aggressiveness; top images) and MDA-MB-231 cells (high aggressiveness; bottom images) 24 h after transfection with 1 μg (108 μM) of γ-TuRC targeting and regulatory peptide, PγTR. At this time point, 43.3% of MCF-7 cells (681/1,572 cells counted from n=12 fields at × 200) and 27.7% of MDA-MB-231 cells (497/1,732 cells counted from n=12 fields at × 200) were transfected with peptide based on fluorescence staining using the 6-His tag. Of this, 39% of MCF-7 cells (613/1,572) and 22.6% of MDA-MB-231 cells were arrested in mitosis. Left images are Hoechst, and right images are merged Hoechst+PγTR for both cell lines. Scale bar, 50 μm.

