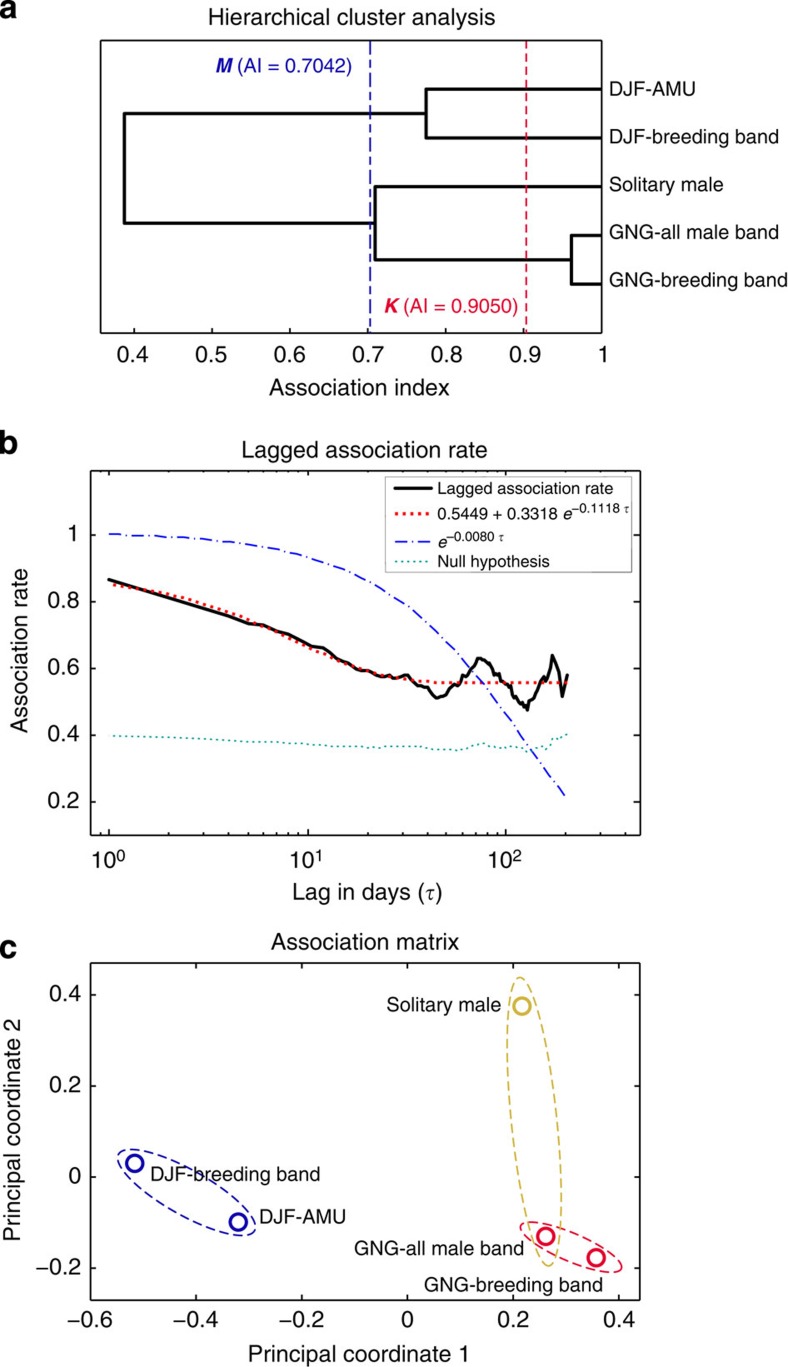
Figure 2. Associations between the social components of the R. roxellana WRT at Zhouzhi from 2012 to 2013.
(a) Association dendrogram; M, the blue-dashed line, is the maximum value showing the modularity of the dendrogram, which represents the recommended cutoff value defining a herd; K, the red-dashed line, based on the knot diagram, provides the cumulative number of bifurcations at different association distances. (b) Lagged association rates and null association rates with two fitted models of exponential decay in association. (c) Result of the principal coordinates analysis identifying different levels of social hierarchy (based on the association matrix of the half-weighted indexes (HWIs)); distance between social components is inversely proportional to the square root of their HWIs.

