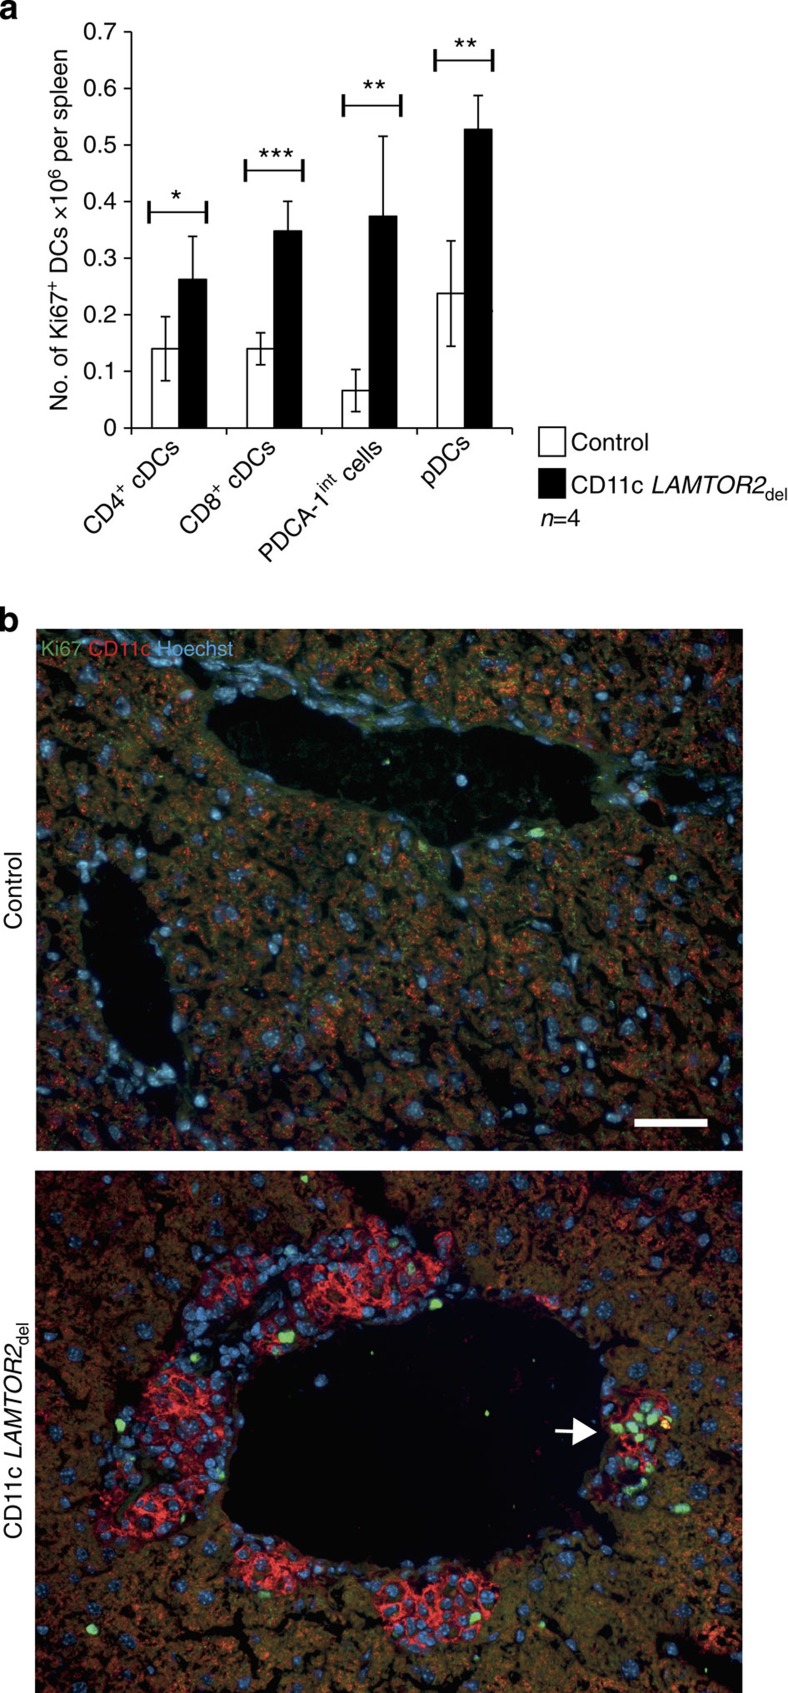
Figure 5. Increased proliferation of DCs.
(a) Proliferation of the described DC subsets of four control and CD11c LAMTOR2del mice was analysed by Ki67 staining. Shown are the numbers of Ki67-positive cells per spleen. Mean±s.d., *P<0.05, **P<0.01, ***P<0,001 as determined by unpaired Student’s t-test. (b) Frozen liver sections of control and CD11c LAMTOR2del mice were stained for CD11c (red), Ki67 (green) and the nucleus (Hoechst). White arrow points at a CD11c-positive infiltrate with Ki67-positive cells. Scale bar, 50 μm.

