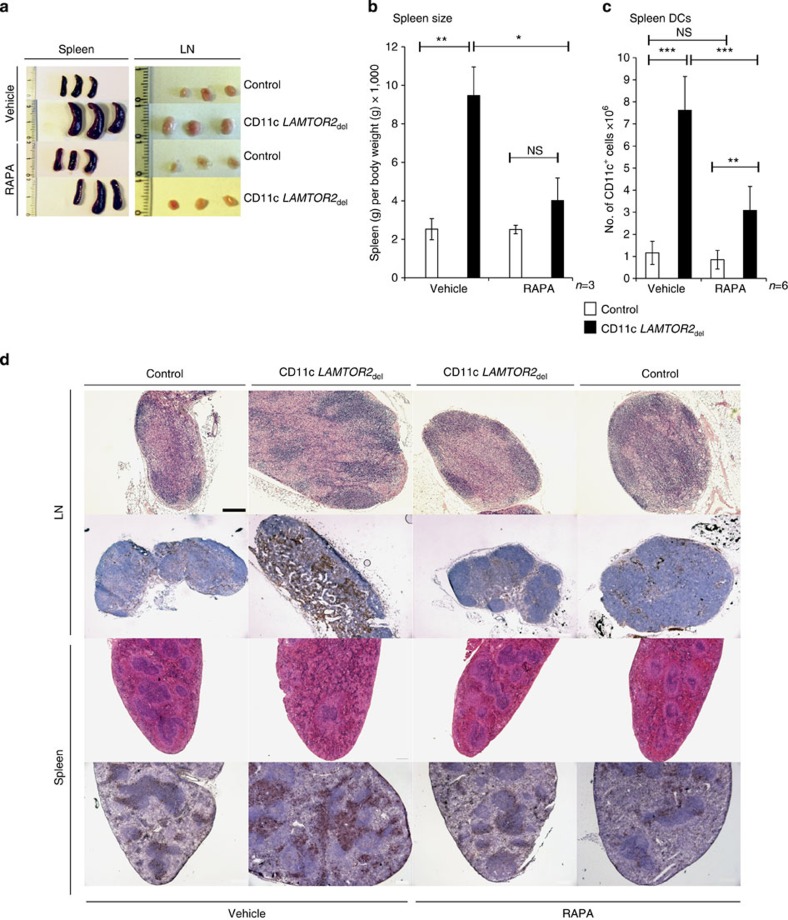
Figure 9. Inhibition of mTOR signalling by Rapamycin in vivo restores phenotype.
Female mice at the age of 3 months were injected daily for 10 days with 30 μg Rapamycin i.p. and killed on day 10. (a) A panel with photographs taken of treated and untreated spleens and LNs from control and deficient animals is shown. Three biological replicates for each genotype and treatment are displayed. (b) The graph shows measured spleen weights of control and CD11c LAMTOR2del mice treated with Rapamycin and untreated. The spleen weight was correlated to the body weight of the animal. Each group contains three mice. Mean±s.d., ns: P>0.05, *P<0.05, **P<0.01 as determined by unpaired Student’s t-test. (c) Flow cytometry analysis of DC populations of treated and untreated animals were performed. Freshly isolated cells from spleen tissue of control and CD11c LAMTOR2del mice were analysed. The total amount of splenic CD11c+ cells was calculated (right graph). At least six mice per treatment and genotype are shown. Mean±s.d., **P<0.01, ***P<0.001 as determined by unpaired Student’s t-test (d) Stained sections of LNs (upper part of the panel) and spleen (lower part) taken from treated and untreated mice from each genotype are shown. Paraffin sections were stained with H&E (first and third row) and cryosections were stained against CD11c (brown) and counterstained with haematoxylin (second and fourth row). Scale bar, 200 μm.

