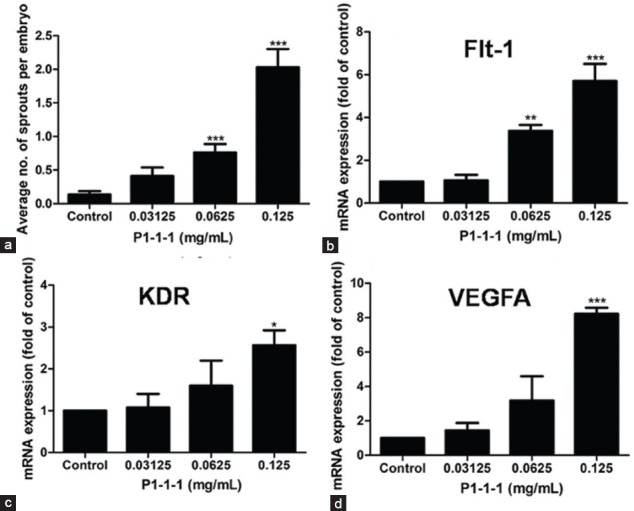
Figure 3.

Effects of P1-1-1 on sprout formation and mRNA expression of three angiogenic markers (Flt-1, KDR, VEGFA) in zebrafish embryos. (a) Sprout formation was expressed as number of sprouts per embryo (mean ± SEM) of not less than three independent experiments. For (b) Flt-1, (c) KDR, and (d) VEGFA, the expression levels were normalized and expressed as mean ± SEM of not less than three independent experiments. *P < 0.05, **P < 0.01, and ***P < 0.001 indicate significant difference when compared to control using one-way ANOVA with Dunnett's multiple comparison test
