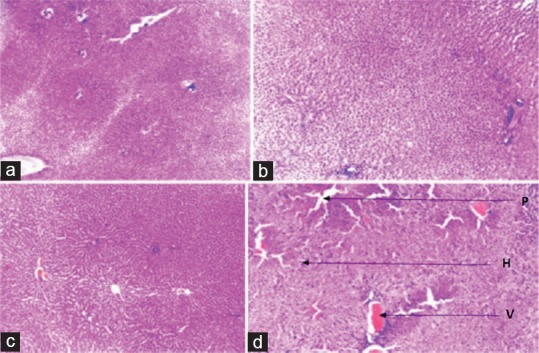
Figure 4.

Liver histology. (a) Negative control, with normal liver histology, (b) no significant changes observed with 100 mg/kg, (c) proliferation of the tissue observed with 2000 mg/kg, (d) proliferation of the tissue stroma, oedema (p), dilatation and haemorrhage within the central vein (v), increase in size of the hepatocytes (h) observed with 4000 mg/kg
