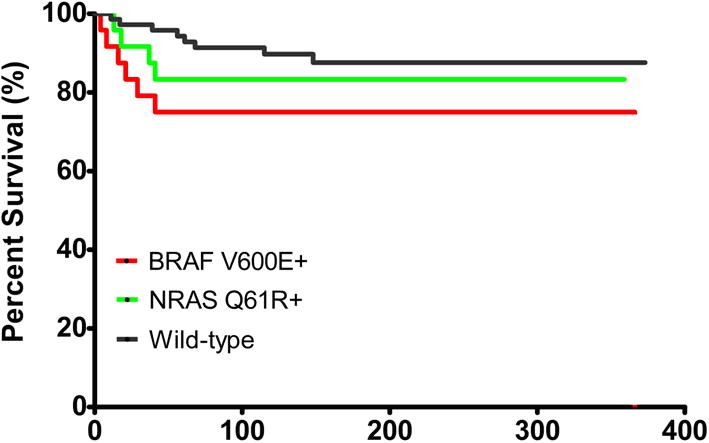
Figure 2.

Kaplan–Meier curve for melanoma-specific survival among melanoma patients, according to mutation status of BRAFV600E and NRASQ61R. Red line: survival for patients with BRAFV600E mutation; green line: survival for patients with NRASQ61R mutation; and black line: survival for patients with wild-type at both loci.
