
Figure 2.
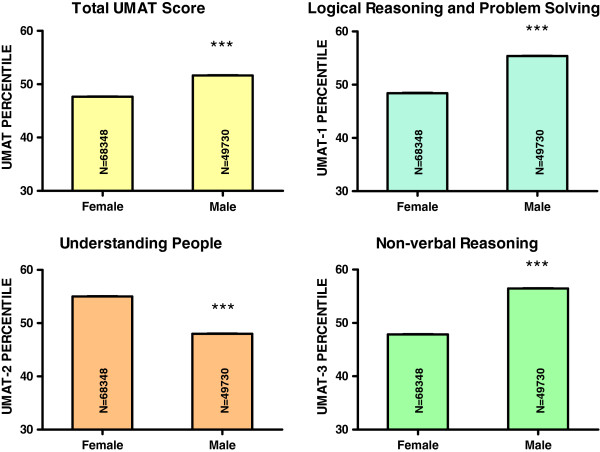
Percentile score for total UMAT, UMAT-1, UMAT-2 and UMAT-3 by gender for all Australian subjects first sitting the UMAT from 2000 to 2012 (N = 118,078). (*** P < 0.001 – one way ANOVA post-hoc comparisons with Bonferroni correction).
Official websites use .gov
A
.gov website belongs to an official
government organization in the United States.
Secure .gov websites use HTTPS
A lock (
) or https:// means you've safely
connected to the .gov website. Share sensitive
information only on official, secure websites.
Percentile score for total UMAT, UMAT-1, UMAT-2 and UMAT-3 by gender for all Australian subjects first sitting the UMAT from 2000 to 2012 (N = 118,078). (*** P < 0.001 – one way ANOVA post-hoc comparisons with Bonferroni correction).