
Figure 6.
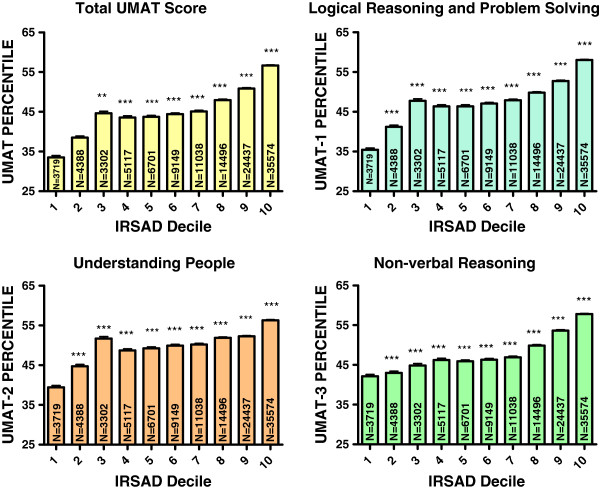
Percentile score for total UMAT, UMAT-1, UMAT-2 and UMAT-3 by deciles for index of relative socio-economic advantage and disadvantage score for all Australian subjects first sitting the UMAT from 2000 to 2012 (N = 117,347). (** P < 0.01, *** P < 0.001 – one way ANOVA post-hoc comparisons with Bonferroni correction).