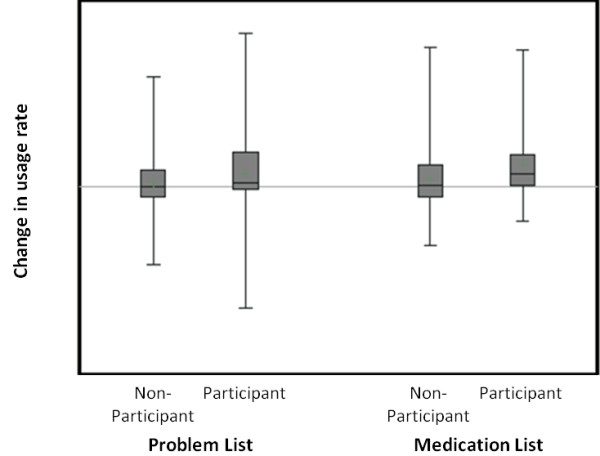
Figure 3.

Effect of training on use of problem lists and medication lists. Each box and whisker represents the distribution of performance scores for either problem list usage (left) or medication list usage (right). The box represents the inter-quartile range, while the upper and lower lines indicate the extreme values. The horizontal line in each box indicates the mean.
