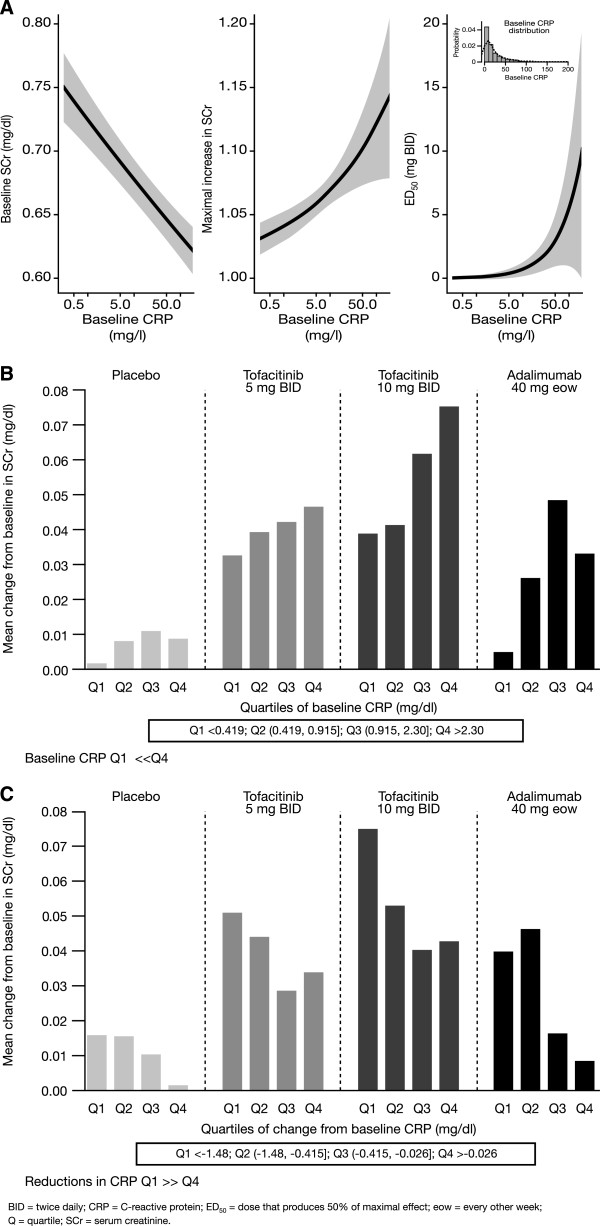
Figure 3.

Relationships between SCr and CRP using Phase 2 modeling data and Phase 3 data. (A) Relationships between SCr model parameters and baseline CRP. (B) SCr increases at Month 3 by baseline CRP; baseline CRP Q1 < < Q4. (C) SCr increases at Month 3 by change in CRP at Month 3; reductions in CRP Q1 > > Q4.
