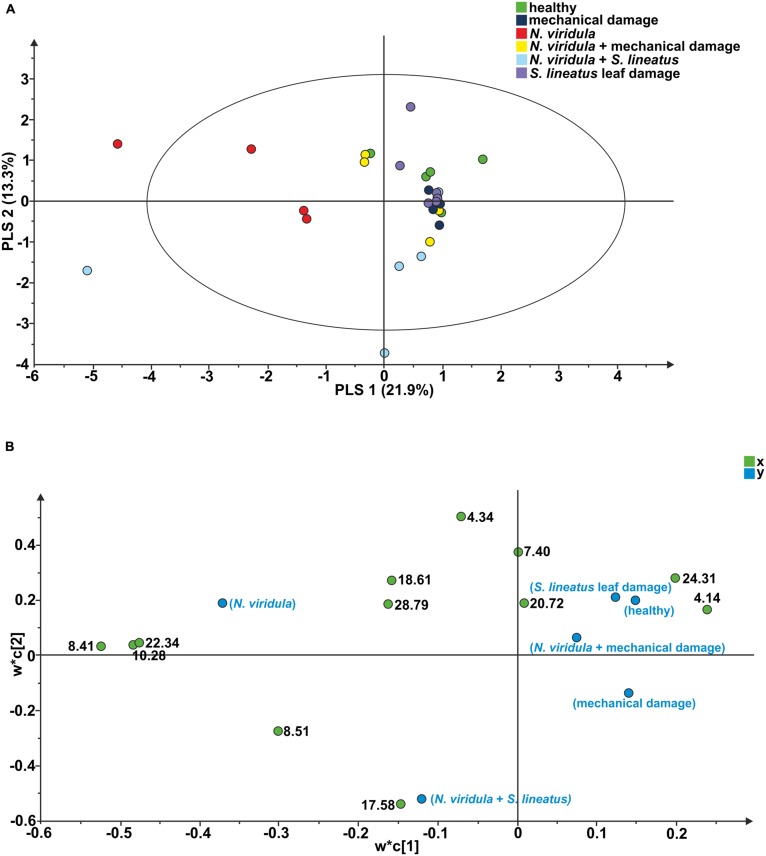
FIGURE 4.
Projection to latent structures discriminant analysis (PLS-DA) comparison of the volatile compounds emitted by individual V. faba plants. (A) Score plot of the samples, with the percentage of explained variation in parentheses. The PLS-DA resulted in a model with two significant principal components (PCs). The ellipse defines the Hotelling’s T2 confidence region (95%). (B) Loading plot of the first two components of the PLS-DA, showing the contribution of each of the compounds toward the model. Numbers refer to the retention time of volatile compounds.

