Figure 2.
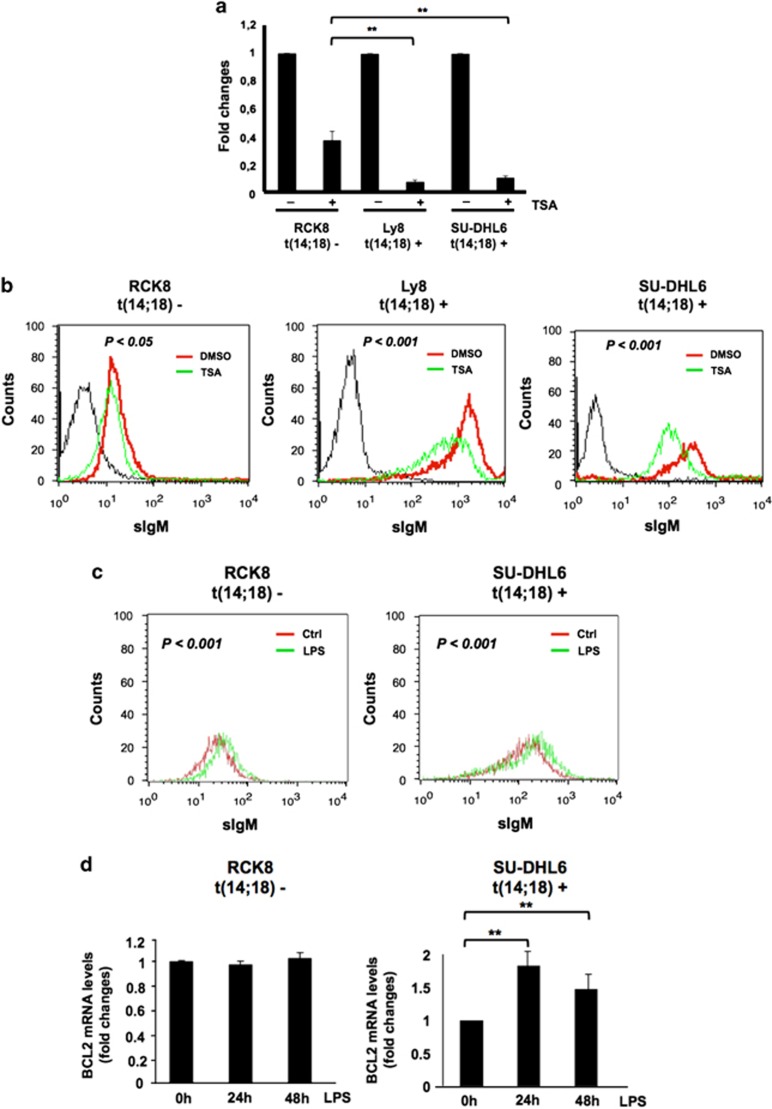
BCL2 and sIgH show coordinated stimulation-induced changes. To modulate the activity of the IgH-3′RRs, t(14;18)-positive lymphoma cells SU-DHL-6 and Ly8 and t(14;18)-negative RCK8 were treated for 1 h with 500 ng/ml. TSA diluted from a stock solution in dimethyl sulfoxide (DMSO). (a) BCL2 mRNA levels were determined by quantitative real-time RT-PCR during TSA treatment. For each condition, BCL2 mRNA levels were normalized to the expression of the glyceraldehyde 3-phosphate dehydrogenase (GAPDH) housekeeping gene. Fold changes in BCL2 mRNA expression were calculated by comparing TSA-treated cells to control cells. Standard deviations and statistics were calculated from three independent experiments. **P<0.01. (b) Intensities of surface IgM (sIgM) immunoglobulin expression (sIgM) were measured by flow cytometry (black, unstained control; red, control DMSO-treated cells; green, TSA-treated cells). P-value was calculated using the nonparametric Kolmogorov–Smirnov test to compare shifted IgM expression. (c) t(14;18)-positive SU-DHL-6 and -negative RCK8 lymphoma cells were stimulated for 24 or 48 h with 1 μg/ml LPS and flow cytometry for sIgM was performed as described. P-value was calculated using the nonparametric Kolmogorov–Smirnov test to compare shifted IgM expression. (d) BCL2 mRNA levels were determined by quantitative real-time RT-PCR at the indicated time point of LPS treatment. For each condition, BCL2 mRNA levels were normalized to the expression of the GAPDH housekeeping gene. Fold changes in BCL2 mRNA expression were calculated by comparing LPS-treated to control cells. Standard deviations and statistics were calculated from three independent experiments. **P<0.01.

