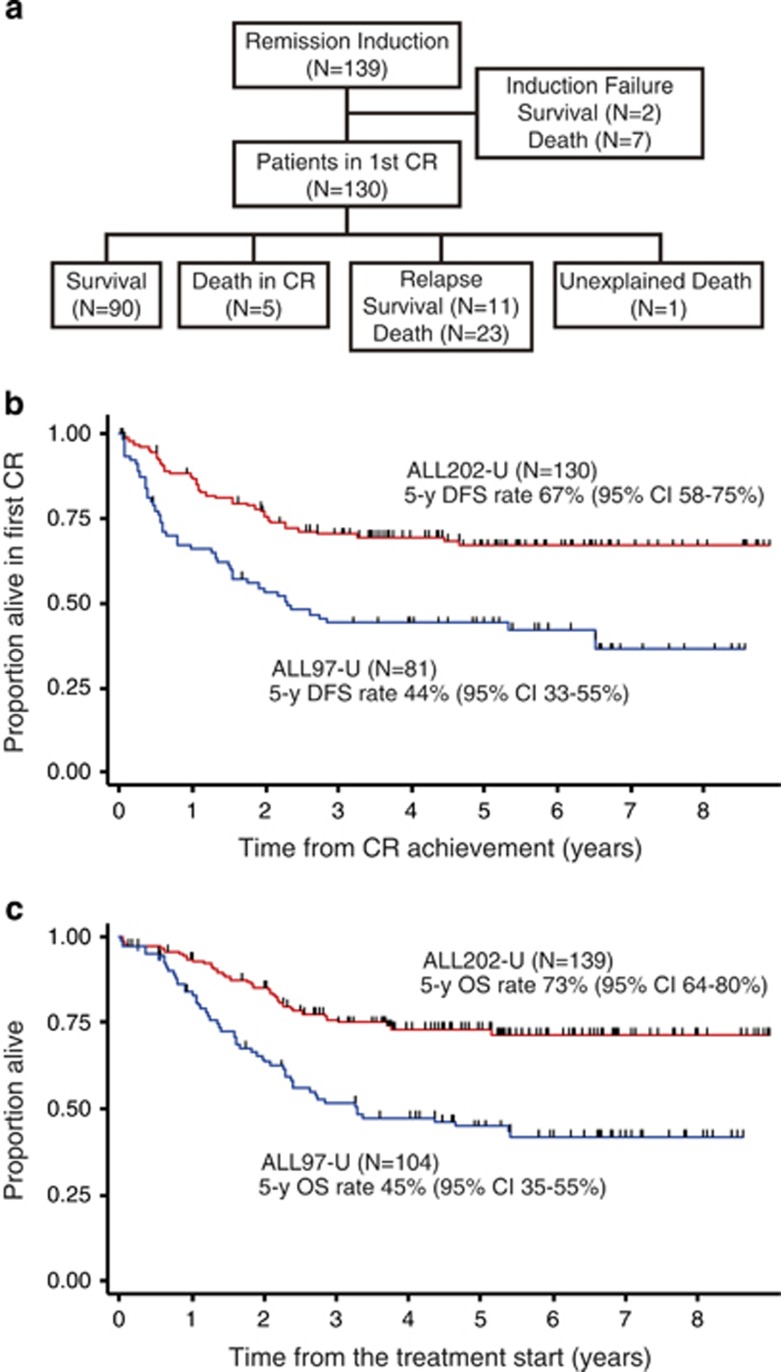
Figure 1.
Comparison of DFS and OS rates. (a) Patient flow chart. (b) Comparison of DFS rates between ALL202-U (red line) and ALL97-U (blue line). The median follow-up times were 5.1 and 5.2 years, respectively. (c) Comparison of OS rates between ALL202-U (red line) and ALL97-U (blue line). The median follow-up times were 5.1 and 5.8 years, respectively.

