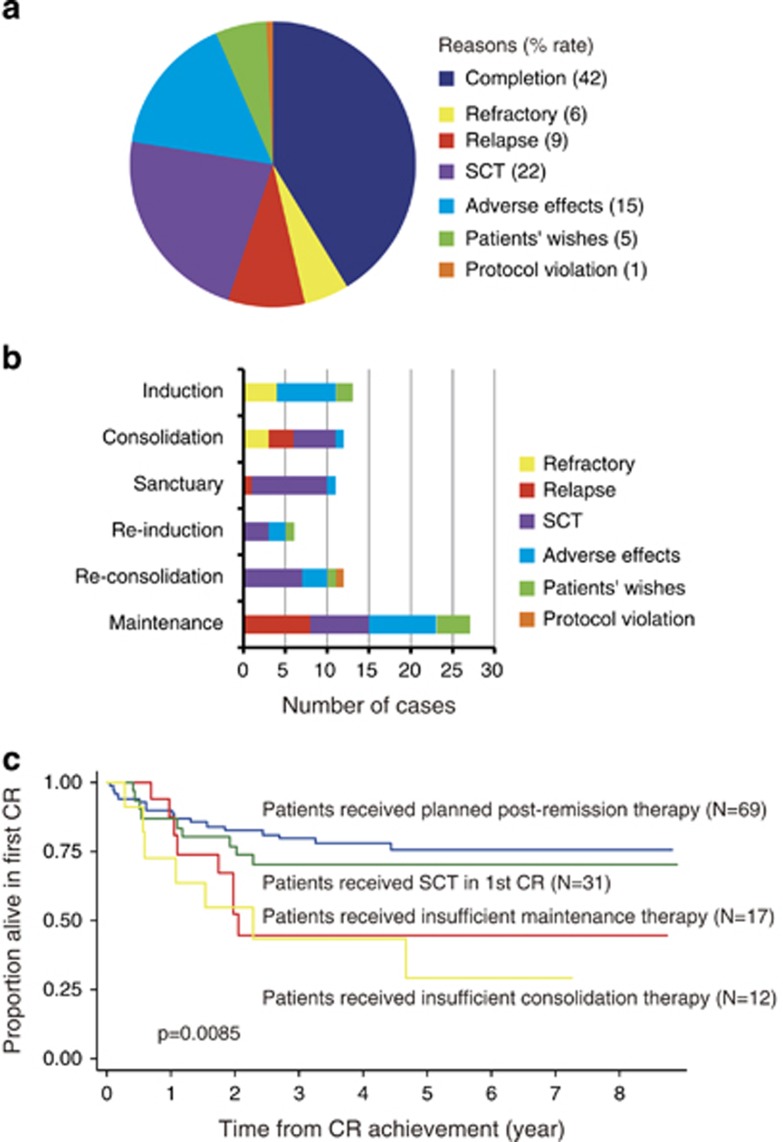
Figure 4.
Analysis of protocol therapy termination. (a) The reasons for and frequencies of protocol therapy termination. (b) The periods of and reasons for protocol therapy termination. (c) The effect of therapy insufficiency on the DFS rate. DFS rates were compared among groups of patients who received planned post-remission therapy (blue line), those who received SCT in first CR (green line), those who received insufficient consolidation therapy (yellow line) and those who received insufficient maintenance therapy (red line).

