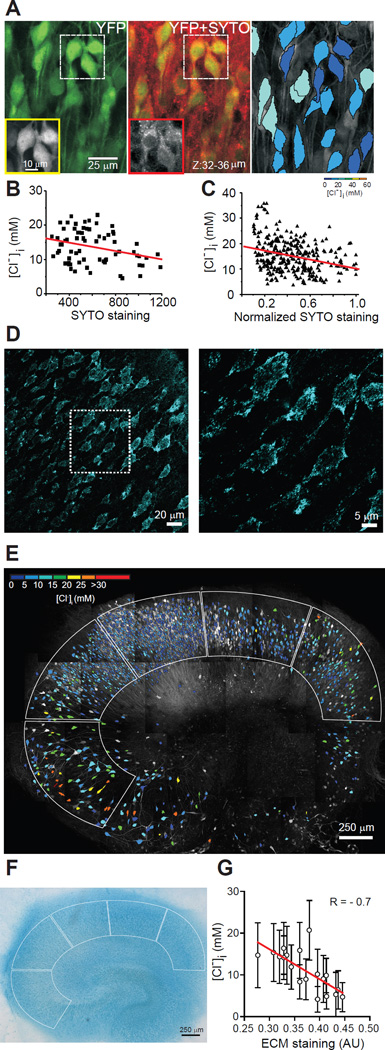
Fig. 2. Correlation of [A]i and [A]o with neuronal [Cl−]i.
A: Left, z-stacked 2-photon image of YFP (green) from CA1 pyramidal layer in an organotypic hippocampal slice from a Clomeleon mouse. Middle, SYTO64 staining (red) of cytoplasmic/nuclear nucleic acids overlaid on the YFP image. Boxes: YFP and SYTO64 fluorescence in individual neurons. Right, Pseudo-colored neurons based on YFP/CFP ratio. B: [Cl−]i as a function of SYTO64 labeling. R = −0.29, P = 0.01, n = 70 neurons; one slice. C: [Cl−]i as a function of normalized SYTO64 labeling. R = −0.3, P < 0.001, n = 305 neurons; 4 slices. Line, linear fit. D-F: Correlation between sulfated extracellular matrix and [Cl−]i. D: Confocal images of Alcian blue staining in CA1 pyramidal layer of an organotypic hippocampal slice. Outlined area magnified in right panel. E: [Cl−]i distribution before Alcian blue staining. Borders: ROI used to calculate average [Cl−]i and Alcian blue staining intensity. F: Alcian blue staining of slice in E, transmitted light. G: Correlation between [Cl−]i and extracellular matrix (Alcian blue staining) obtained in each region of interest, 4 slices. Bars = SD; AU: arbitrary units. Line, linear fit (P < 0.001).

