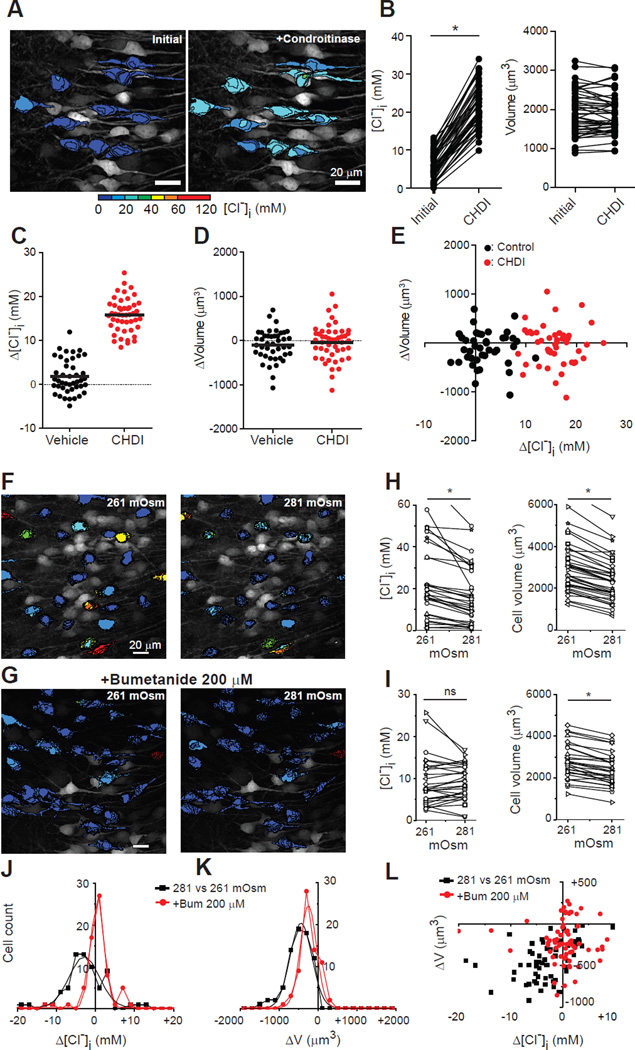
Fig. 3. [Cl−]i is changed by disruption of the extracellular matrix and by increased extracellular osmolarity.
A: Pseudo-colored, two-photon z-stack image before and after incubation with chondroitinase ABC (CHDI) in an organotypic hippocampal slice. B: Significant effect of CHDI on [Cl−]i, but not volume. C: [Cl−]i change by incubation with vehicle vs. CHDI solution (Vehicle: +0.8 ± 3.9 mM, n = 43; 4 slices; CHDI; +15.8 ± 3.8 mM, n = 47; 4 slices; P < 0.0001, unpaired t-test). D: As C but plotting somatic volume (vehicle; −52 ± 174 µm3, CHDI; −23 ± 203 µm3, P = 0.46 unpaired t-test. Change in vehicle: 1699 ± 480 to 1647 ± 464 µm3, P = 0.08. Change in CHDI: 1905 ± 564 to 1882 ± 516 µm3, P = 0.51, Wilcoxon signed rank test, same cells as C). E: Volume vs. [Cl−]i changes for each neuron in C-D. * P < 0.0001. F, G: Organotypic hippocampal slices expressing Clomeleon (two-photon) after increasing osmolarity with 20 mM Mannitol (8% increase), and in bumetanide (G). H-I: [Cl−]i and neuronal volume changes in mannitol (H) and plus bumetanide (I). J-K: [Cl−]i and neuronal somatic volume changes induced by increased extracellular osmolarity. L: Neuronal volume changes as a function of [Cl−] changes.

