
Figure 2.
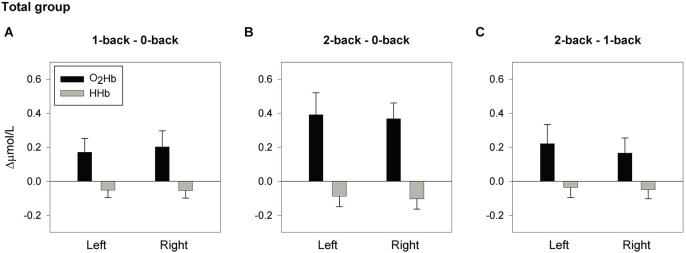
Hemodynamic concentration changes in the total sample of older adults. Mean (± SEM) changes of [O2Hb] and [HHb] in the left and right hemisphere for the spatial 1-back minus 0-back contrast (A), 2-back minus 0-back contrast (B), and 2-back minus 1-back contrast (C).