Figure 10.

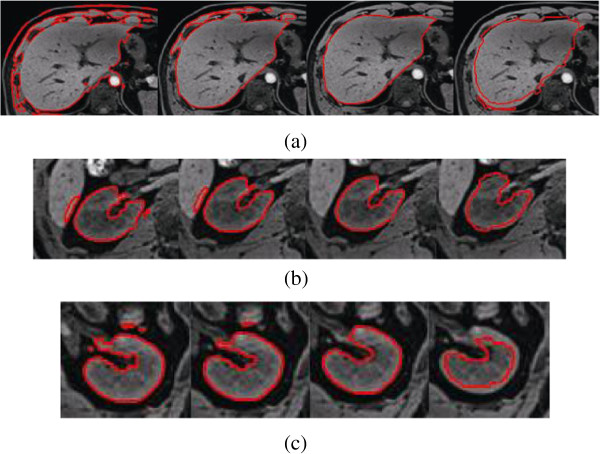
The segmentation of different η using the proposed method, from left to right in each row, (a)liver: η = 0.8, 0.7, 0.65, 0.6; (b) right kidney: η = 0.8, 0.75, 0.72, 0.7; (c) left kidney: η = 0.9, 0. 8, 0.75, 0.7.

The segmentation of different η using the proposed method, from left to right in each row, (a)liver: η = 0.8, 0.7, 0.65, 0.6; (b) right kidney: η = 0.8, 0.75, 0.72, 0.7; (c) left kidney: η = 0.9, 0. 8, 0.75, 0.7.