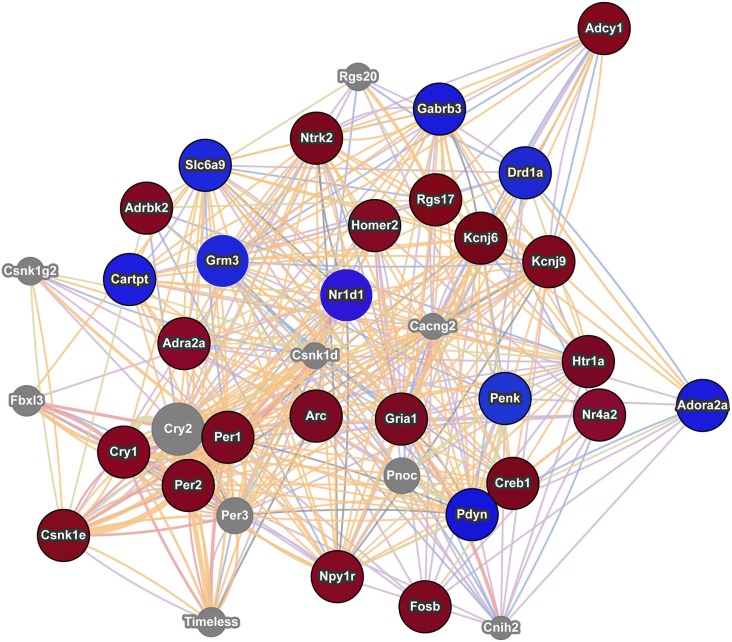
Figure 3.
Interaction network of addiction related genes with altered expression in postpartum NAC. The red circles indicate upregulation and blue circles indicate downregulation of genes within significant maternal NAC expression results. Results were visualized as an interaction network with genes in gray circles added by GeneMania due to interactions with specified genes. Nr1d1 was added to network due to recent studies linking it to addiction pathways and because of its multiple interactions with known addiction related genes. The nature of the interaction data linking any two genes is encoded by color (blue lines = colocalization, purple lines = coexpression, red lines = physical interactions, light green = shared protein domains, and orange lines = predicted interaction). Distance between genes is proportional to the strength of evidence for their interaction.

