
Figure 5.
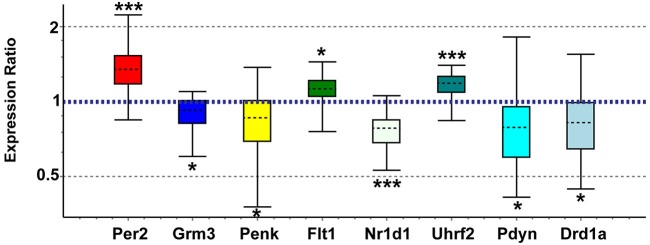
Quantitative real-time PCR confirmation of expression changes for genes of interest in maternal NAC compared to virgin. Relative expression distribution (Y-axis) represented as a ratio of postpartum vs. virgin (n = 10 per group) normalized against two references genes, Ppia and Ywhaz, and shown by box-and-whisker plots as medians (black dashed lines), interquartile ranges (boxes), and ranges (whiskers). Ratios over 1 indicate genes that are more highly expressed in postpartum NAC than in virgin, while ratios less than 1 indicate genes with lower expression in postpartum females. *p < 0.05; ***p < 0.001.