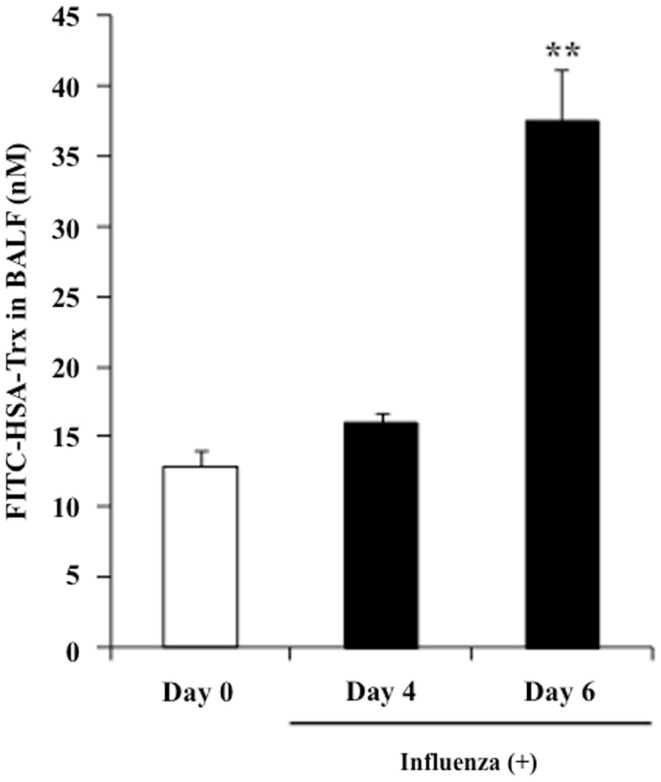
Figure 8.
BALF distribution of FITC-labeled HSA–Trx in influenza-infected mice. BALF levels of FITC-labeled HSA–Trx after intravenous administration into the tail vein of normal (Day 0) or influenza-infected (Day 4 or 6) mice were determined using fluorescence spectroscopy. Each point represents the mean ± SE (n = 4). **P < 0.01 vs. Day 0.

