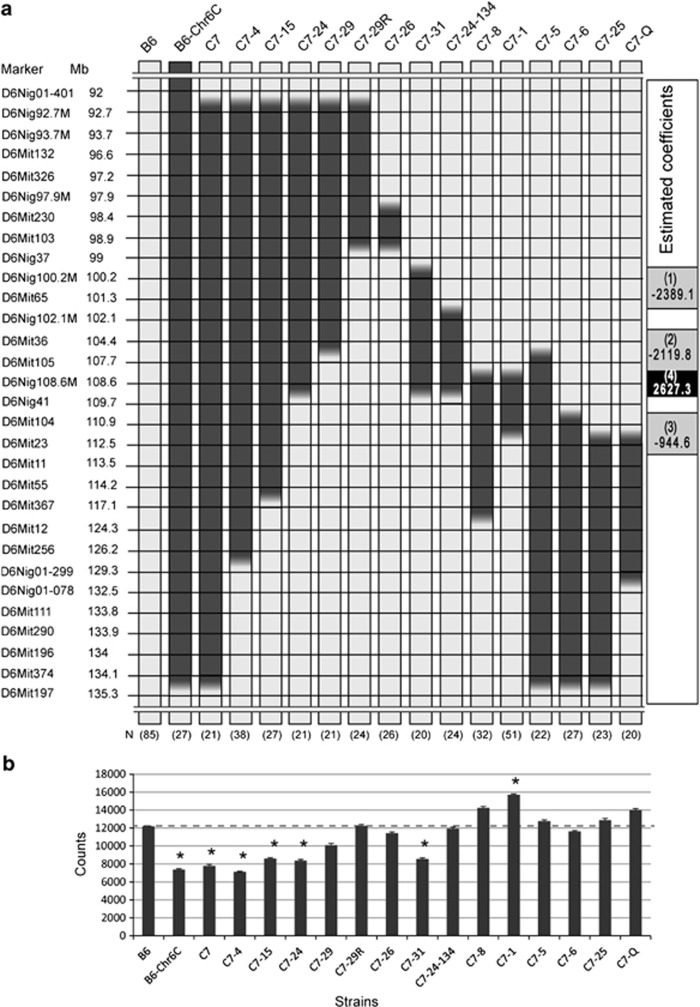
Figure 3.
Fine mapping of genetic loci for total activity using congenic strains. (a) The congenic strains used for the behavioural test, numbers of mice used for each strain and genotype of microsatellite markers on chromosome 6 are indicated. The light grey box and the filled box indicate the genotype of microsatellite markers of B6 and MSM, respectively. The gradated boxes indicate boundaries between two microsatellite markers in which recombination occurred. (b) Comparison of total activity in a series of congenic strains as well as parental strains. Data are shown as the mean±s.e. The dashed line indicates score of the control strain, B6. Asterisks (*) indicate significant differences in total activities compared with B6 according to the t-test with Bonferroni's correction at P<0.05. Significant estimates of the coefficients identified by the regression analysis and their positions are shown on the right side of the panel. The effects of the coefficients of decreasing the total activity are shown in grey cells and the effect of the coefficient of increasing the total activity is shown in the black cell with white text. The numbers shown in parentheses indicate the locus name.

