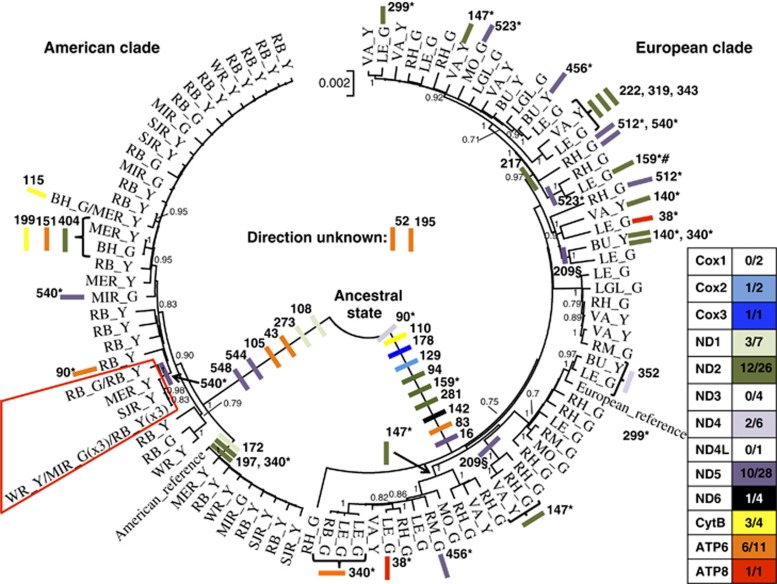
Figure 2.
Neighbour-joining tree of 96 mitogenome haplotypes. Bootstrap support >0.7 is shown above the branching points. The direction of nonsynonymous change is represented by coloured bars for all 13 genes along the respective branches and only given for mutations supported by at least two independent sequences. Numbers within gene boxes are the number of observed supported nonsynonymous changes compared with the total number of nonsynonymous changes. Amino-acid positions are shown next to the respective bar and a ‘*' denotes that the substitution is observed in sequences of independent ancestry. A ‘§' denotes that different amino-acid changes have occurred at this position and ‘#' denotes a back mutation. A ‘/' in the sequence name is used to separate between sampling location where haplotypes are shared between multiple samples. The red shape denotes the clade within the American lineage showing possible selection (see text). See Table 1 for sampling codes for individual sequences.

