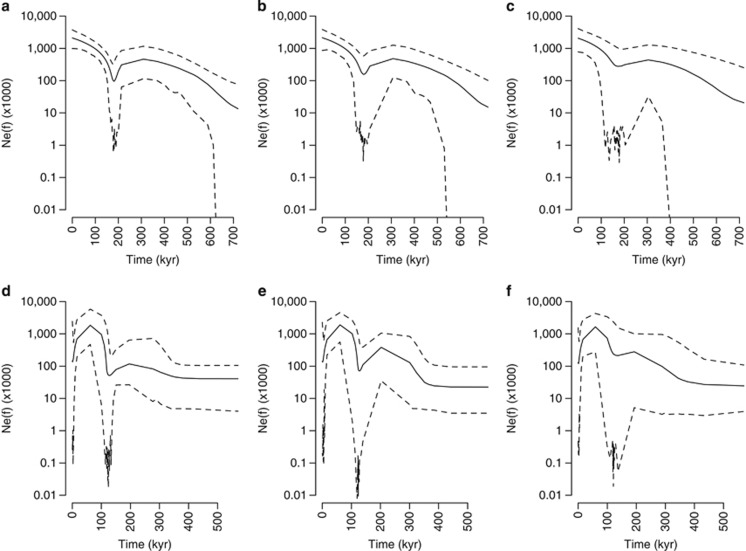
Figure 3.
EBSPs of long-term trends in female effective population size (Nef). Solid lines represent median Nef-values, whereas dashed lines represent 95% HPD intervals. (a–c) European eel and (d–f) American eel. X-axes represent time and are scaled using estimates of TMRCA from the species phylogeny. (a, b and d, e) Time scaled by mean TMRCA using either the whole (a+d) or the partitioned mitogenome (b+e). (c and f) time scaled using the 95% HPD from the species analysis for the partitioned mitogenome.

