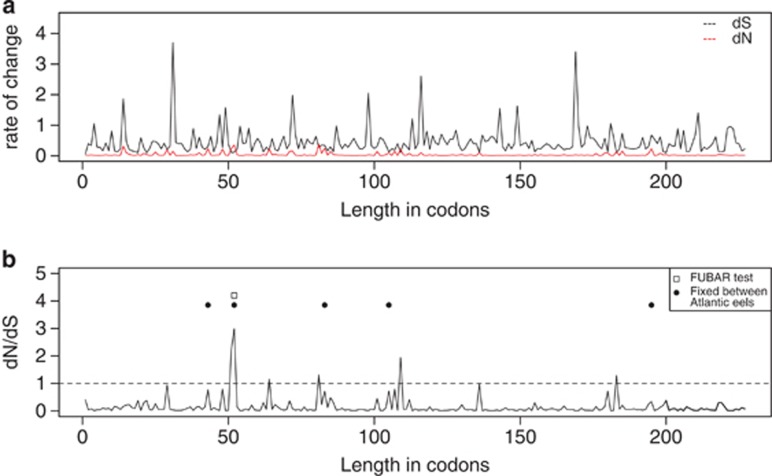
Figure 4.
Results of the FUBAR test along the ATP6 gene. (a) Rate of synonymous (dS) and nonsynonymous change (dN), and (b) dN/dS. Position 52 that showed significantly elevated dN/dS is denoted by a square, whereas the five fixed nonsynonymous amino-acid changes between European and American eels are denoted by dots.

