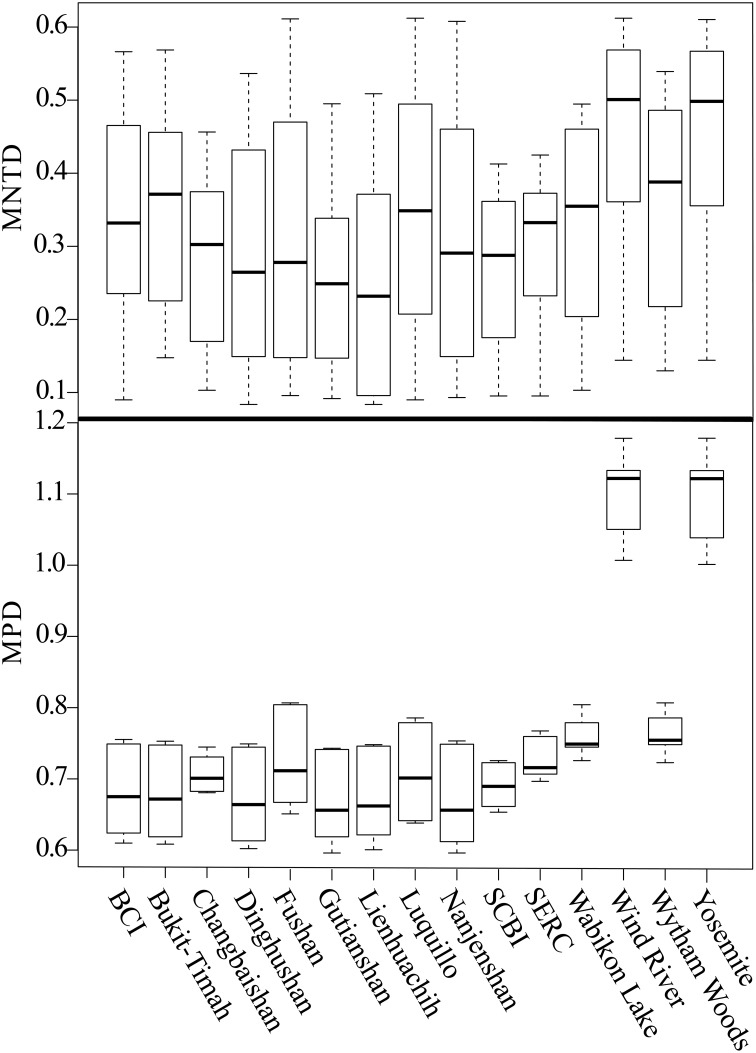
Figure 5.
Two methods to infer differentiation among communities are shown, with the inter-community MNTD (top) and inter-community MPD (bottom). Boxplots for each community show the mean (dark bar within box), interquartile range (box), and 95% confidence interval (whisker bars), computed from all pairwise contrasts between plots.

