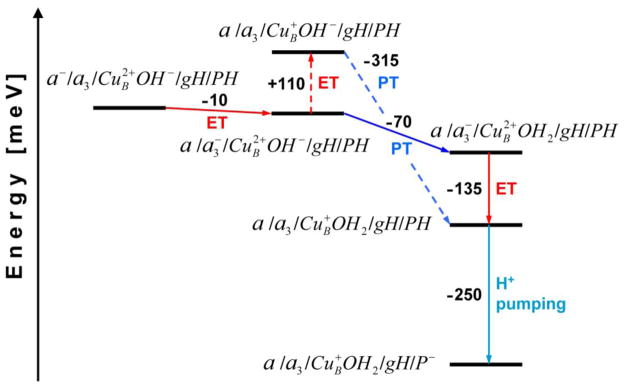
Figure 7.

The energy diagram illustrating the transfer of a chemical proton and an electron transfer within the binuclear center at pH 7. The red, blue and turquoise lines refer to electron transfer (ET), proton transfer (PT), and proton pumping step, respectively. The dashed-line shows a thermodynamically less favorable path. The redox/protonation state changes of CcO are designated in the following order: heme a/heme a3/CuB–oxygen ligand/E242/H291.
