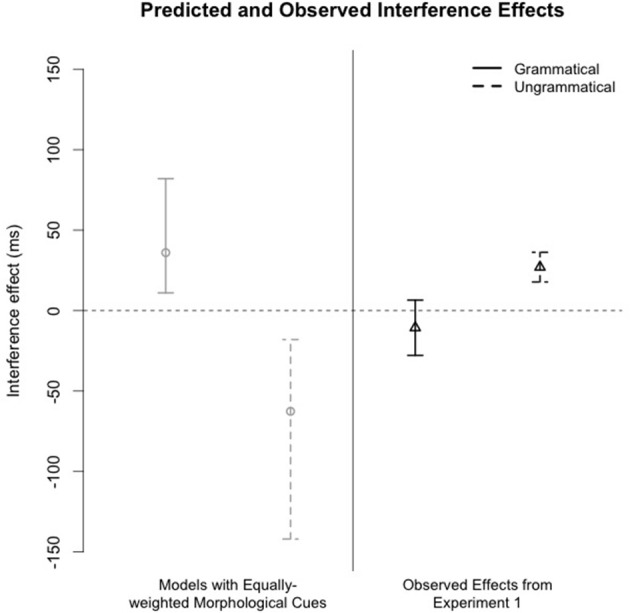
Figure 4.

Comparison of predicted interference effects from model simulations and observed interference effects from Experiment 1. Models simulated expected retrieval latencies if morphological and positional cues were assigned equal weights in antecedent retrieval. For the simulated data, error bars represent the middle 95% of the distribution of predicted interference effects. Error bars around the empirical means mark the 95% CI.
