Figure 1.
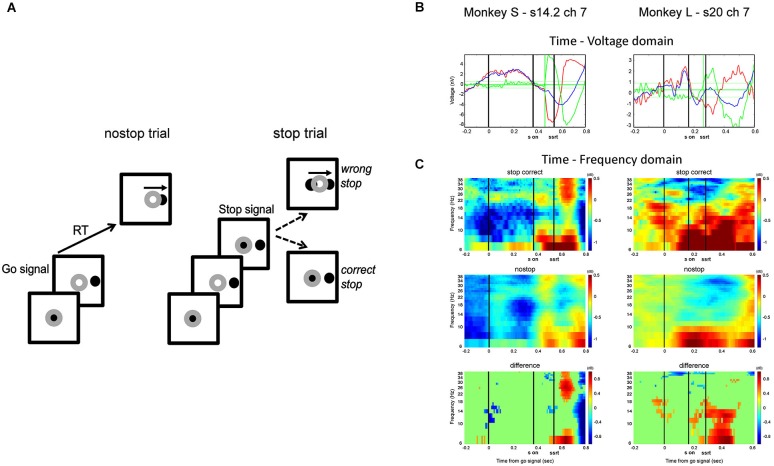
(A) Countermanding reaching task: each trial began with the hand (represented by the gray annulus) on the central black circle. After a random time, the central circle disappeared, and a target appeared in 1 of 2 opposite positions (Go signal; only one position is represented). In no-stop trials, the hand had to leave the resting position and touch the peripheral circle. In stop trials, after a variable delay (SSD) after the Go signal, the central circle reappeared (Stop signal), requiring the monkey to cancel the planned movement. (B) Two example channels that were selected for further analysis on the basis of their modulation. Red line represents the average activity of correct stop trials, the blue line is the average activity of latency-matched no-stop trials, and the green line is the difference between them. Horizontal green lines represent mean ± 2.5 SD of the difference between no-stop and correct stop trials in the 300 ms preceding the go signal (see text for further details). (C) Time-frequency plots showing the contribution of the beta and alpha bands in stop correct trials (top row) and no-stop latency-matched trials (middle row) and the difference between them (bottom row) for each monkey (S on, stop signal onset; SSRT is the estimated latency of the Stop Signal Reaction Time).

