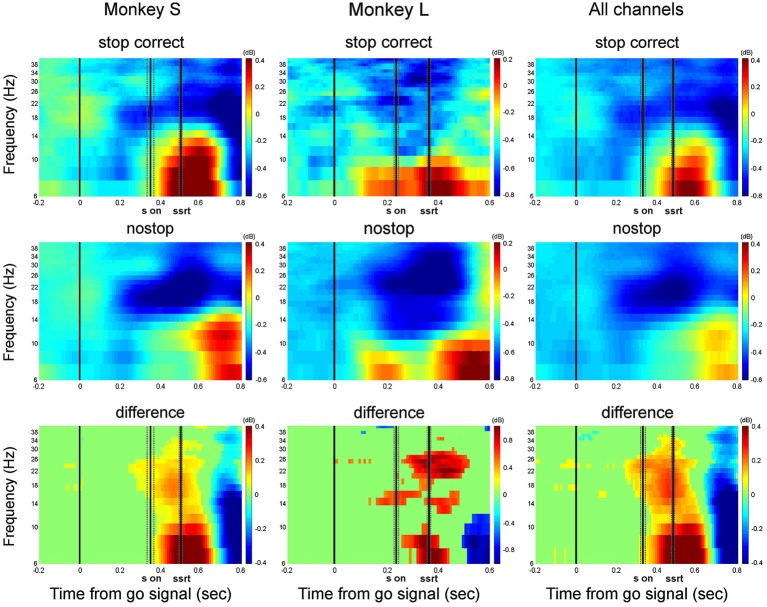
Figure 4.
Grand average of the time-frequency plots of correct stop trials (upper panels) and latency-matched no-stop trials (middle panels) and their difference (bottom panels). Data are presented aligned to the go signal separately for each monkey (Monkey S and Monkey L), and across all channels. Other conventions as in Figures 1, 2.

