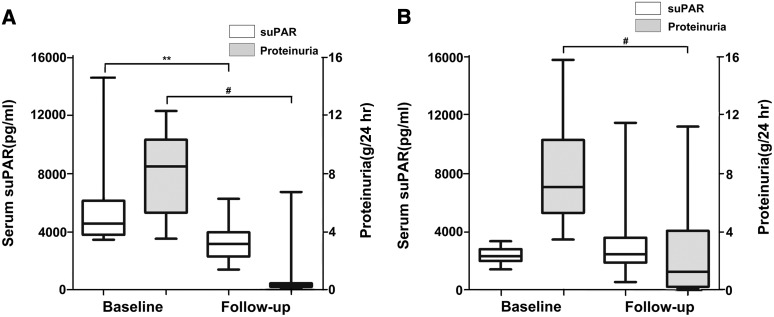
Figure 4.
suPAR changes from baseline to follow-up in patients with FSGS. The suPAR levels and proteinuria changes in (A) the high-suPAR group (suPAR level ≥3400 pg/ml; *P=0.002 for baseline suPAR versus follow-up suPAR; #P<0.001 for baseline proteinuria versus follow-up proteinuria) and (B) the low-suPAR group (suPAR level <3400 pg/ml; #P<0.001 for baseline proteinuria versus follow-up proteinuria). The box plots indicate the median and interquartile ranges (25th and 75th percentiles), and the whiskers indicate the 1st and 99th percentiles.

