
Fig. 3.
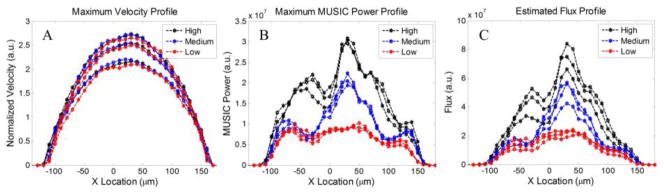
(A) Estimated velocity. Flow profiles of four syringe flow velocities (125, 150, 175 and 200 μL/min) along the tube with various concentration of particles. (B) Estimated MUSIC power peak for the profiles shown in Fig. 3(A). (C) Estimated MUSIC flux profile.