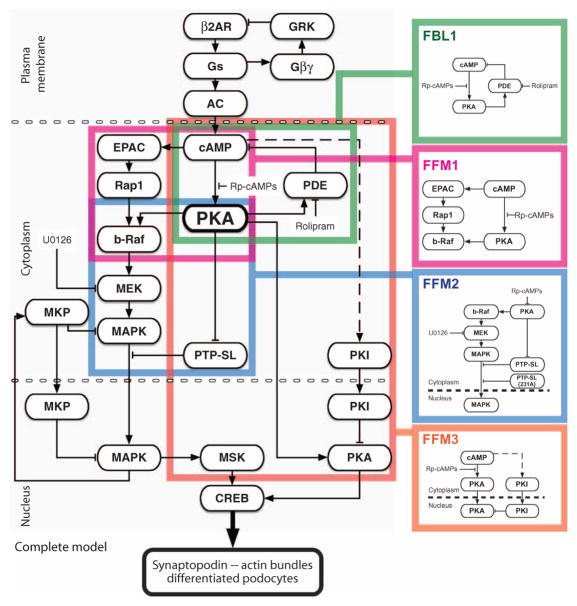
Fig. 3. Minimally complex directed graph of the cAMP signaling network that controls CREB phosphorylation in the context of podocyte synaptopodin expression and actin bundling.
The right-sized model from Fig. 2B is marked with color-coded boxes to highlight the four key regulatory motifs; these motifs are shown separately on the right for clarity.

