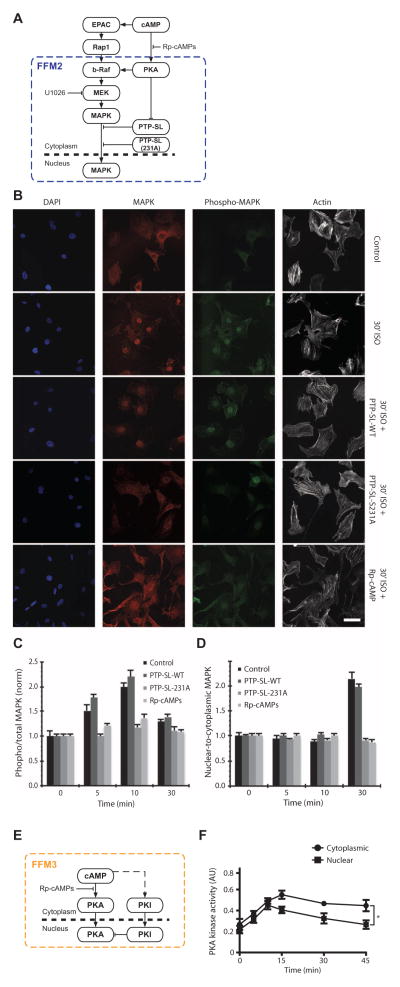
Fig. 6. Regulatory motifs within cAMP network are spatially specified.
(A) Schematic representation of FFM2. (B) Immunofluorescence images of cultured podocytes at baseline (Control) and 30 min of isoproterenol stimulation under basal (30′ ISO) conditions or with wild-type (WT) PTP-SL transfection, S231 mutant PTP-SL transfection, or preincubated with 100 μm Rp-cAMPs. Cells are stained for MAPK1,2 (red), phospho-MAPK (green), and actin (white), and nuclei-labeled with DAPI (4′,6-diamidino-2-phenylindole) (blue). Scale bar, 50 μm. (C) Time course of MAPK1,2 activation as measured by ratiometric quantification of phospho-MAPK and total MAPK immunofluorescence images. Values are means ± SEM; n = 24 cells over seven slides in three experiments. (D) Time course of MAPK1,2 translocation to the nucleus as measured by ratiometric quantification of immunofluorescence images. Values are means ± SEM; n = 24 cells over seven slides in three experiments. (E) Schematic representation of FFM3. (F) Time course of activated PKA in the cytoplasm and nucleus as measured by enzymatic assays after subcellular fractionation (*P < 0.05, two-way ANOVA; n = 3).

