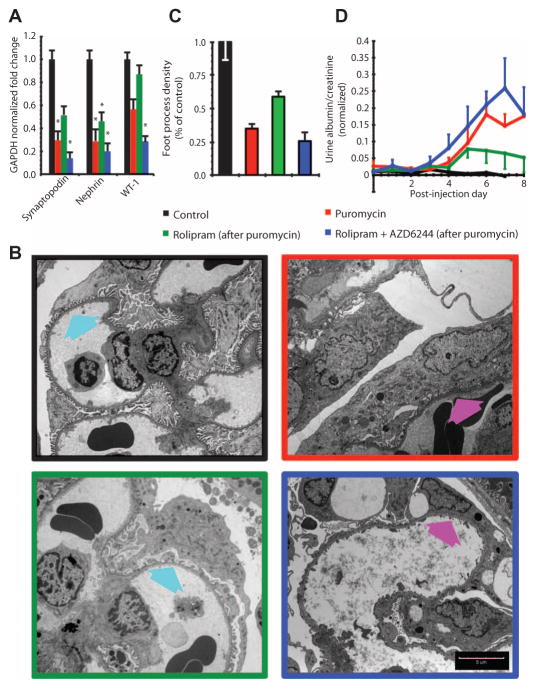
Fig. 8. Compensatory modulation of a regulatory motif by pharmacologic agents restores podocyte morphology and function in vivo.
(A) Modulation of FBL1 and FFM2 in vivo recapitulates computationally predicted behavior in puromycin-induced nephropathy. Loss of expression of podocyte differentiation markers nephrin, synaptopodin, and WT-1, as measured by RT-PCR in rats subjected to the indicated treatments. Values are means ± SEM; *P < 0.05 versus control, one-way ANOVA; n = 4 rats for each condition. (B) Transmission electron microscopy images of glomerular podocytes from healthy animals (black border), puromycin-induced nephropathy (red border) animals, nephropathy animals with FBL1 inhibition by rolipram (green border), or nephropathy animals with simultaneous FBL1 and FFM2 inhibition by rolipram plus AZD6244 (blue border). Arrows point to interdigitating foot process morphology (cyan arrows) that was disrupted in untreated and rolipram plus AZD6244–treated puromycin animals (magenta arrows). Scale bar, 5 μm. (C) Blinded quantification of foot process morphology shown in (B). All groups are significantly different from each of the other groups (P < 0.05, one-way ANOVA; n = 60, 15 images from four rats for each condition). (D) Glomerular pathophysiology as measured by protein in urine. Glomerular function in animals treated with puromycin and animals treated with rolipram plus AZD6244 (after puromycin) was significantly different from control (P < 0.05, two-way ANOVA with post hoc Tukey test; n = 4 rats). There was no statistical difference between control animals and animals treated with rolipram (after puromycin).

