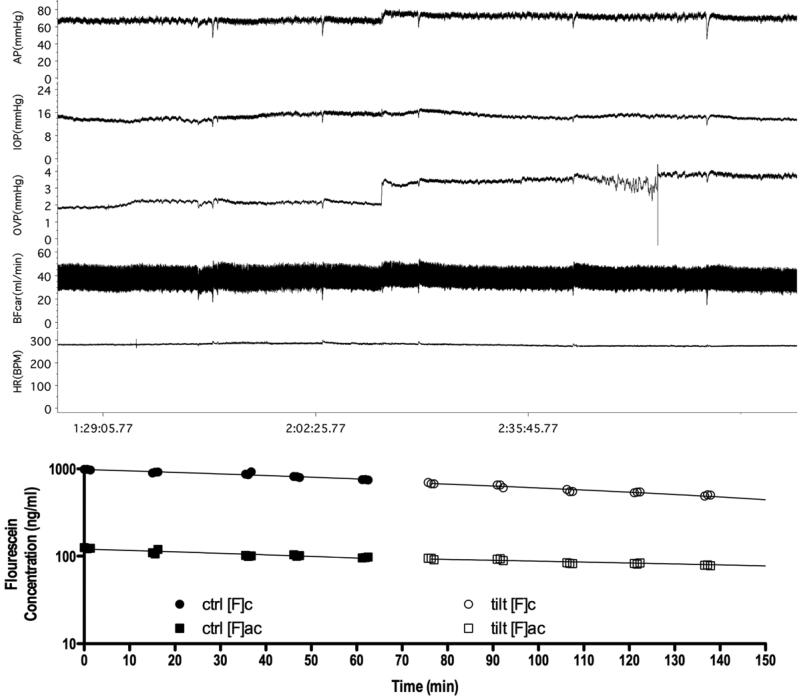
Figure 4.
Aqueous flow protocol. . A typical trace is shown from an aqueous flow experiment. The protocol entailed 60 minutes of measurements with the animal supine. Then the animal was tilted for an additional 60 minutes. Triplicate fluorophotometric scans were performed every 15 min to calculate aqueous flow. (ctrl: control supine period; tilt: head-down tilt period; [F]c: cornea fluorescein concentration; [F]ac: anterior chamber fluorescein concentration)

