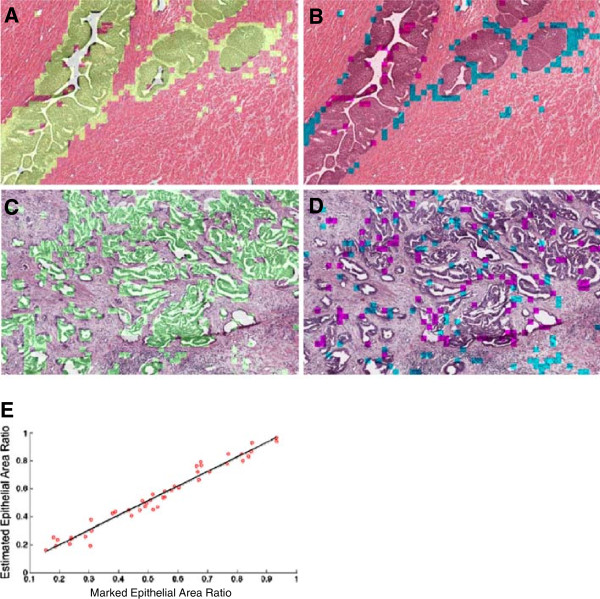
Figure 4.

Method output and cross-validation. The in-house color-based segmentation algorithm was implemented on micrographs of H&E stained prostate tissue sections of 8 normal prostate tissues and 36 prostate tumors to segment the testing images into epithelial and non-epithelial regions. The method output is depicted for a normal (A, B) and a cancerous (C, D) tissue sections. In the left column, the estimated epithelial regions are highlighted in green. In the right column, the false positive and false negative regions are highlighted in blue and magenta, respectively. The set of 44 H&E histology micrographs representing 44 cases was divided into training and validation datasets. The epithelial, lumenal and stromal clusters were formed by analyzing the training set for each subject. The performance of the classifier was then evaluated by examining the training and validation dataset. (E) The estimated and actual epithelial areas of the validation datasets were well correlated (R2 = 0.965).
