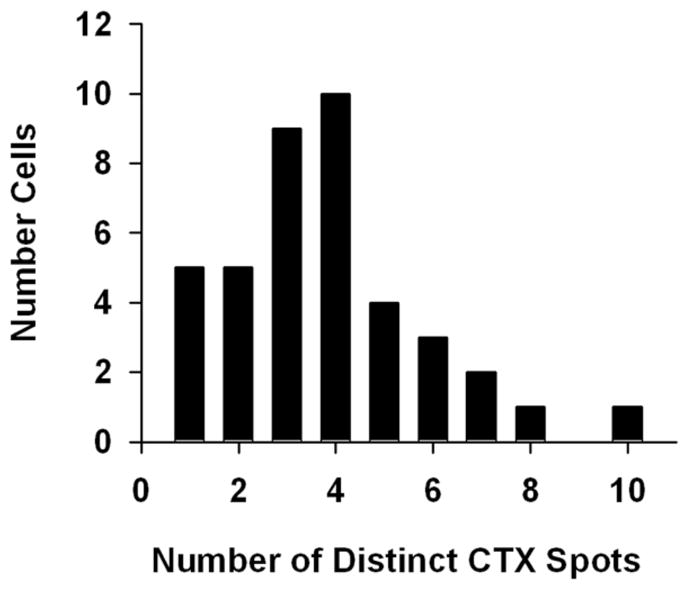
Figure 2. Histogram of CTX puncta shows an average of 3–4 puncta per hair cell.

Pre-fixed, isolated hair cells displaying one or more CTX-puncta were analyzed, revealing a mean of 3.8 ± 0.3 (standard error of the mean) puncta per cell. N = 40.

Pre-fixed, isolated hair cells displaying one or more CTX-puncta were analyzed, revealing a mean of 3.8 ± 0.3 (standard error of the mean) puncta per cell. N = 40.