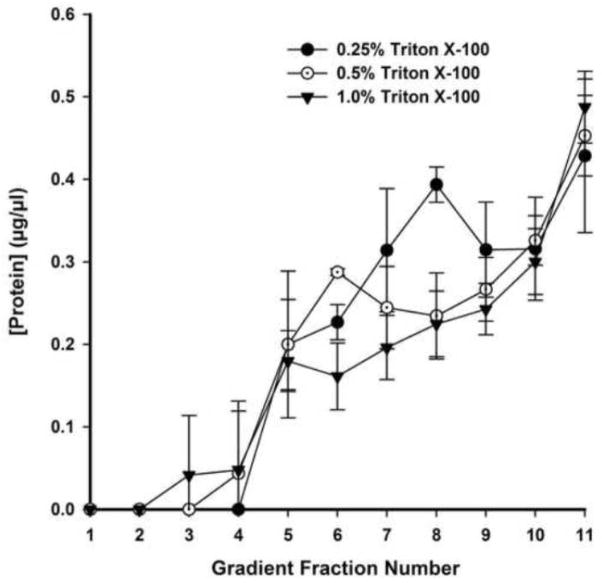
Figure 8. Protein concentration among DRM and non-DRM fractions varies considerably with concentration of TX-100.
Protein concentration was quantified by BCA assay and averaged for fractions 1–11 of 0.25%, 0.5%, and 1% TX-100 treated whole cochlea lysates. N = 3 for each group. Errors represent one standard deviation from the mean.

