Figure 1.

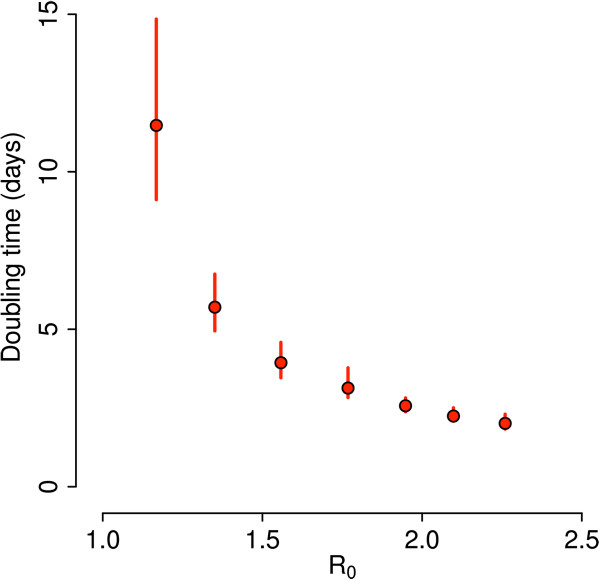
Doubling time. Average doubling time (dots) and 95% CI (vertical lines) as a function of R0. For each value of R0 results were obtained by analyzing 100 uncontrolled (no intervention) simulated epidemics.

Doubling time. Average doubling time (dots) and 95% CI (vertical lines) as a function of R0. For each value of R0 results were obtained by analyzing 100 uncontrolled (no intervention) simulated epidemics.