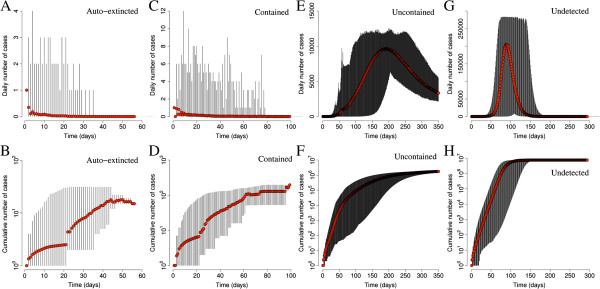
Figure 5.

Epidemic timing. (A) Average number of daily cases as observed in autoextinct simulated epidemics (red points) with R0 = 1.5. Vertical lines represent minimum and maximum daily incidence. (B) As in (A) but for the average cumulative number of cases. (C,D) As (A) and (B) but for contained epidemics by assuming reference interventions. (E,F) As (A) and (B) but for uncontained epidemics by assuming reference interventions. (G,H) As (A) and (B) but for undetected epidemics. A total of 1,000 simulations were undertaken to produce the results shown.
