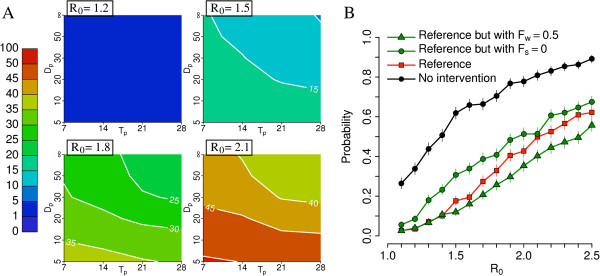
Figure 7.

Sensitivity analysis: school and workplace closure. (A) Probability (×100) of outbreak for different values of R0 by assuming reference scenario with additional workplaces closure (Fw = 0.5) and by varying Dp and Tp. (B) Probability of outbreak for different values of R0 by assuming no intervention scenario, reference scenario, and reference scenarios with different policies regulating school and workplaces closure. A total of 1,000 simulations were undertaken for each parameter set to produce the results shown.
