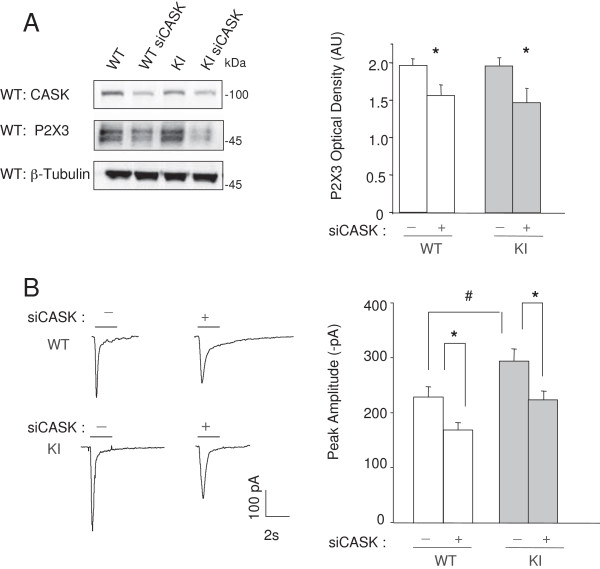
Figure 2.

Effect of siCASK silencing in KI and WT neurons. A, Example of Western immunoblotting for CASK, P2X3 and β-tubulin, in control and after siCASK silencing. Note the significant decrease in P2X3 receptor expression in both WT and KI samples. Histograms show significant reduction of P2X3 protein expression in silenced samples (*p = 0.026 for WT and p = 0.04 for KI; n = 5, number of experiments). B, representative examples of currents induced by α,β-meATP (α,β, black bar, 10 μM) from WT or KI trigeminal neurons in control or after siCASK. Histograms show quantification of mean current amplitude values (WT: 230 ± 19 pA or 170 ± 13 pA; KI: 296 ± 92 pA or 225 ± 16 pA for control or siCASK respectively). # p = 0.036, *p = 0.02 for WT and p = 0.019 for KI; n = 15–23 cells.
