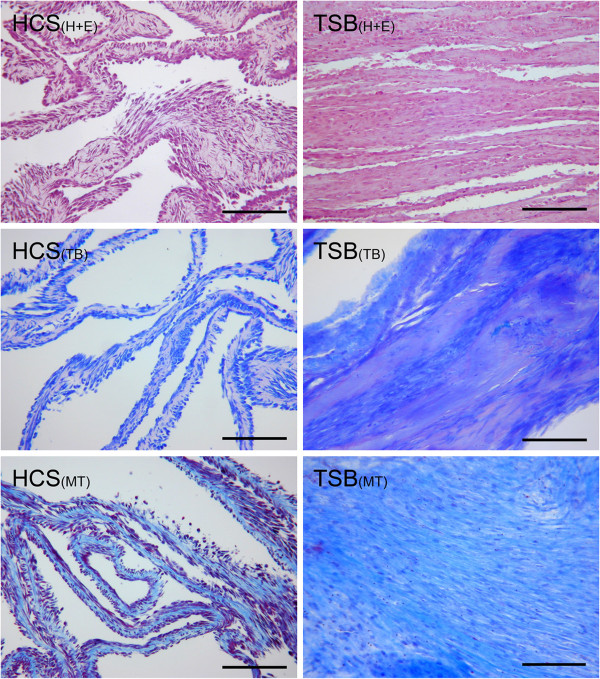
Figure 4.

Histologic Analysis: Hematoxylin and Eosin stain (“H + E”), Toluidine Blue stain for GAG (“TB”), and Masson’s Trichrome stain for collagen (“MT”) of hyperconfluent cell sheets (“HCS”) and tensioned synoviocyte bisocaffolds (“TSB”). 10X objective magnification, bar = 100 μm. Note the difference in tissue architecture between the thin HCS and dense bands and sheets of extracellular matrix in TSB.
