
Figure 2.
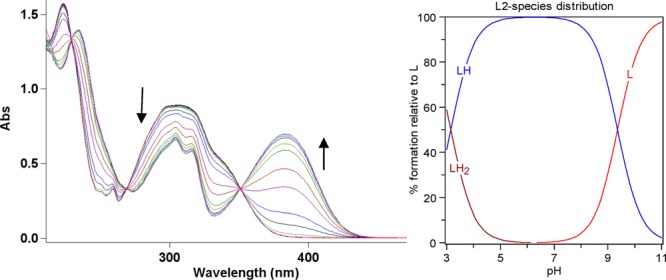
Variable-pH UV spectra of L2 (50 μM, 25 °C, I = 0.1 M NaCl) and the species distribution plot.
Official websites use .gov
A
.gov website belongs to an official
government organization in the United States.
Secure .gov websites use HTTPS
A lock (
) or https:// means you've safely
connected to the .gov website. Share sensitive
information only on official, secure websites.
Variable-pH UV spectra of L2 (50 μM, 25 °C, I = 0.1 M NaCl) and the species distribution plot.