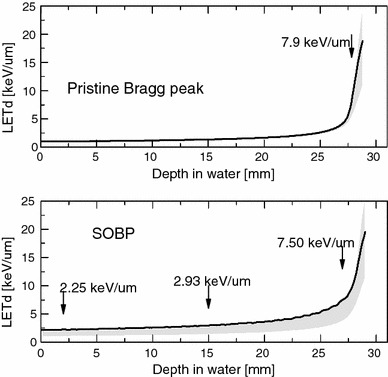
Fig. 2.

Depth distributions of dose-averaged LET (LETd) and of IQR of LETd (shaded) of the proton beam produced at the IFJ PAN, simulated by Monte Carlo calculations. Upper panel: pristine beam; lower panel: SOBP. Calculated values of LETd at irradiation positions are also shown
