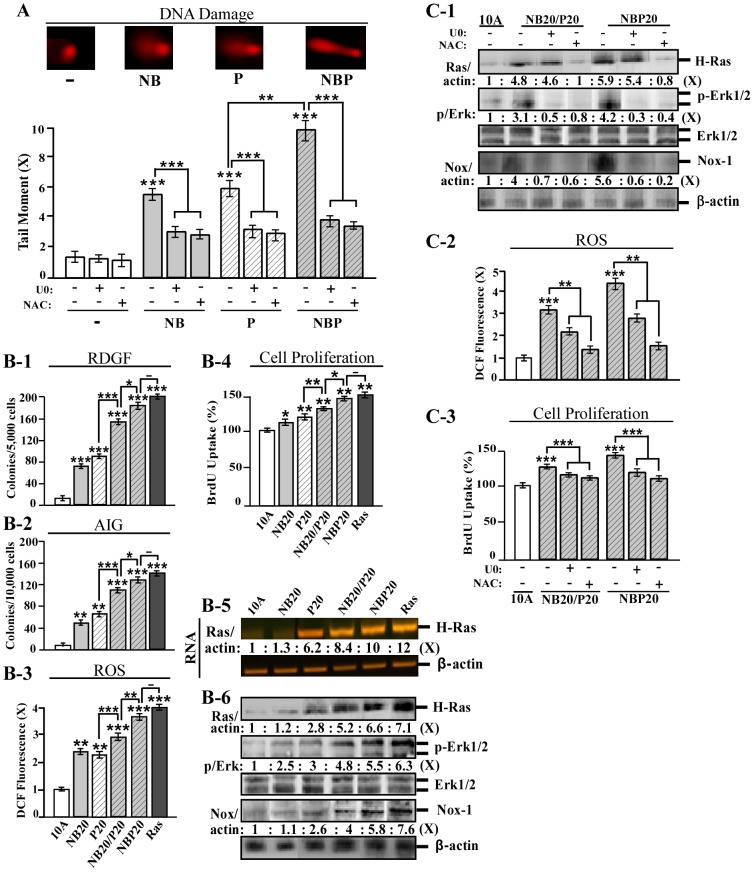
Figure 1. Enhanced cellular acquisition of cancer-associated properties by combined carcinogens.
(A) MCF10A cells were treated with combined 100 pmol/L NNK and 100 pmol/L B[a]P (NB), 10 nmol/L PhIP (P), or combined NB and PhIP (NBP) in the absence and presence of 10 µmol/L U0126 (U0) or 5 mmol/L NAC for 24 h. DNA damage was measured by a comet assay and normalized by the value of average tail moment determined in untreated counterpart cells, set as 1 (X, arbitrary unit). Representative images detected in the comet assay are shown. (B-1 to B-6) MCF10A (10A) cells were repeatedly exposed to NB, PhIP, or NBP for 20 cycles, resulting in the NB20, P20, and NBP20 cell lines, respectively. NB20 cells were then exposed to PhIP for an additional 20 cycles resulting in the NB20/P20 cell line. MCF10A-Ras (Ras) cells were used as a malignant control. (C-1 to C-3) NB20/P20 and NBP20 cells were treated with 10 µmol/L U0 or 5 mmol/L NAC for 48 h. (B-1) To determine cellular acquisition of RDGF, cells were maintained in LM medium for 10 days. Cell colonies ≥0.5 mm diameter were counted. (B-2) To determine cellular acquisition of AIG, cells were seeded in soft agar for 14 days. Cell colonies ≥0.1 mm diameter were counted. (B-3 and C-2) Relative level of ROS as fold induction (X, arbitrary unit) was normalized by the level determined in untreated cells, set as 1. (B-4 and C-3) Relative cell proliferation was determined and normalized by the value of BrdU detected in untreated cells, set as 100%. (B-5) Total RNA was isolated and analyzed by RT-PCR with specific primers to determine relative gene expression levels of H-Ras, with β-actin as a control, and these levels were quantified by densitometry. (B-6 and C-1) Cell lysates were analyzed by immunoblotting using specific antibodies to detect levels of H-Ras, phosphorylated-Erk1/2 (p-Erk1/2), Erk1/2, and Nox-1, with β-actin as a control, and these levels were quantified by densitometry. The levels of H-Ras (Ras/actin) and Nox-1 (Nox/actin) were calculated by normalizing with the level of β-actin and the level set in untreated control cells as 1 (X, arbitrary unit). Levels of specific phosphorylation of Erk1/2 (p/Erk) were calculated by normalizing the levels of p-Erk1/2 with the levels of Erk1/2, then the level set in control cells as 1 (X, arbitrary unit). Columns, mean of triplicates; bars, SD. All results are representative of three independent experiments. Statistical significance is indicated by * P<0.05, ** P<0.01, and *** P<0.001.

