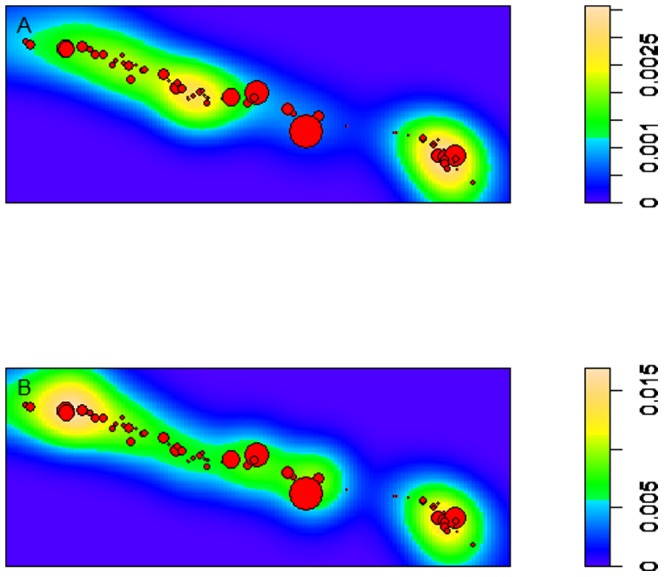
Figure 1. Density plots of colonies of Acropora palmata at Haulover Bay in St. John, United States Virgin Islands (USVI).

Density plot in A) is based on the expected number of random points per unit area (i.e. colony density), where warm colors (yellow) denote dense areas of individual colonies, whereas cool colors indicate locations sparse of coral colonies. The density plot in B) represents the intensity of white-pox disease reoccurrence within the spatial plane of annual disease activity during the 7-year study period, from February 2003 to December 2009. The axes of the spatial area are 220 m by 560 m. The red dots represent the locations of individual coral colonies. The size of the red dots represents initial colony size recorded in February 2003. Density plots were created using the density function of the R package ‘spatstat’.
