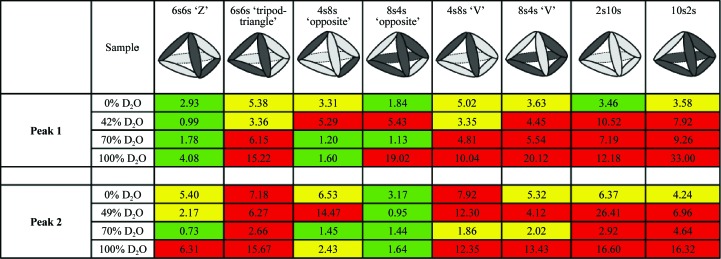
Figure 2.
Overview of the fits of several homodimeric models against the four SANS contrast scattering curves. Deuterated PhTET2 dimers are depicted by dark grey ellipsoids and hydrogenated PhTET3 dimers are depicted as light grey ellipsoids. Green indicates excellent fits against SANS data at the respective H2O/D2O contrast, yellow moderate agreement and red strong disagreement. The numbers indicate the χ2 values obtained with CRYSON. Peak 1 can only be fitted by one model in a satisfactory way (dPhTET2 6s:hPhTET3 6s = ‘Z’), while peak 2 can only be fitted by a single, distinct model (dPhTET2 8s:hPhTET3 4s = ‘opposite’). All other dodecameric models based on homodimeric building blocks can readily be ruled out.

